Sometimes code breaks.
Identifying and fixing issues quickly and efficiently is a basic skill new coders must acquire. This process of finding and fixing errors in code is known as debugging, and is a fundamental skill for anyone programming in Python or any other language, for that matter.
To debug effectively, you should examine the code carefully, understand how it works, and use tools to help you find the source of the problems.
Today, we’re going to discuss popular debugging techniques that you can apply in your next Python project.
Read Errors First
Errors produce tracebacks that indicate the exact issue.
Python shows the file, line number, and error type, like NameError for missing variables.
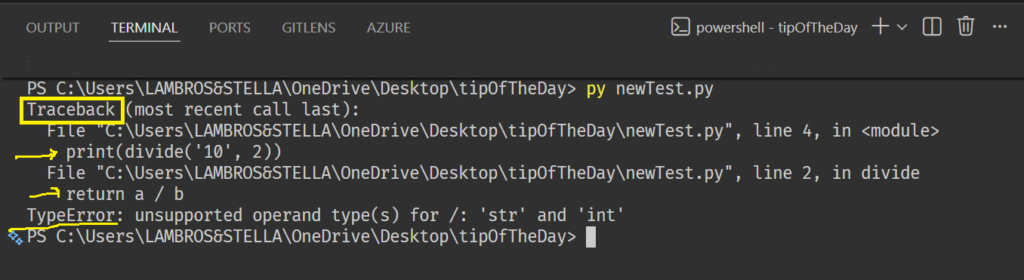
Here, we tried dividing a string by a number. Fix it by converting types, such as int("10"), and run again. Tracebacks save hours if you parse them right.
Print to Track How Everything Flows
Print statements are a great tool for beginners.
Using the print() function along with f-strings at different stages in your code can really help you grasp how everything flows and what the variables are doing.
Consider a function like this:
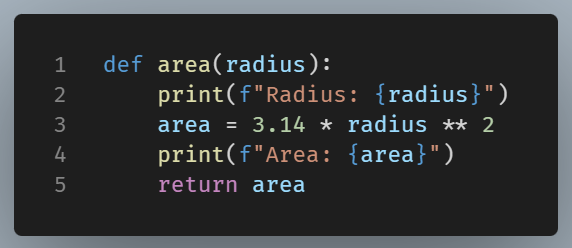
NOTE: All these prints make your code seem cluttered, but at the same time, they give a clear picture of how things flow. You can easily remove prints later.
Use Your Editor’s Power
ManyIntegrated Development Environments (IDEs) come equipped with sophisticated debugging tools, including features like breakpoints, step execution, and the ability to inspect variables.
IDEs like VS Code or PyCharm excel in this area.
Using VS Code Debugger
If you use VS Code, you can set breakpoints in your code and run the debugger to pause execution at those points.
Here’s how to debug the same divide function:
Step1: First, create a file and name it test.py. Then add the following code:
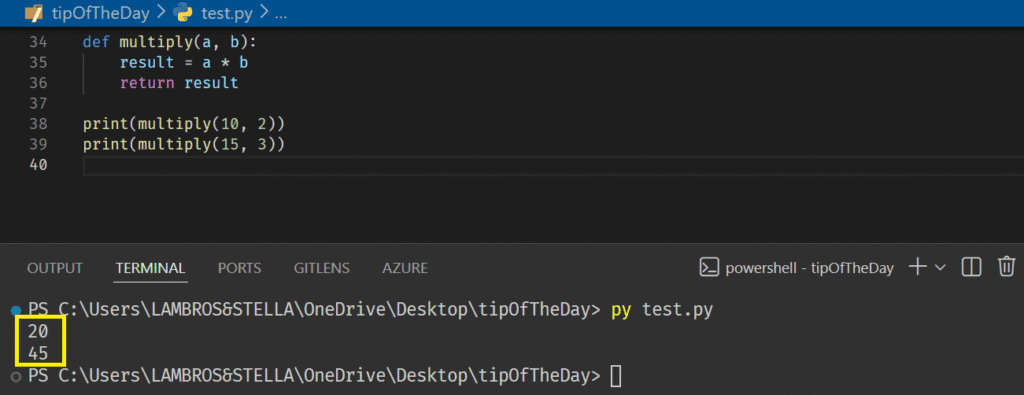
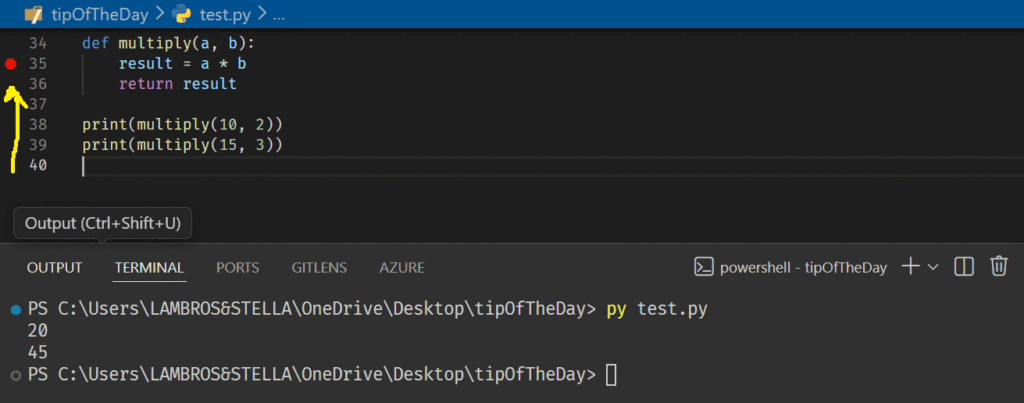
Step 2: Setting a breakpoint
- In the left margin of line 35 (
result = a * b), set a breakpoint. - You will see a red dot appear there when you click in, which indicates that the breakpoint has been set.
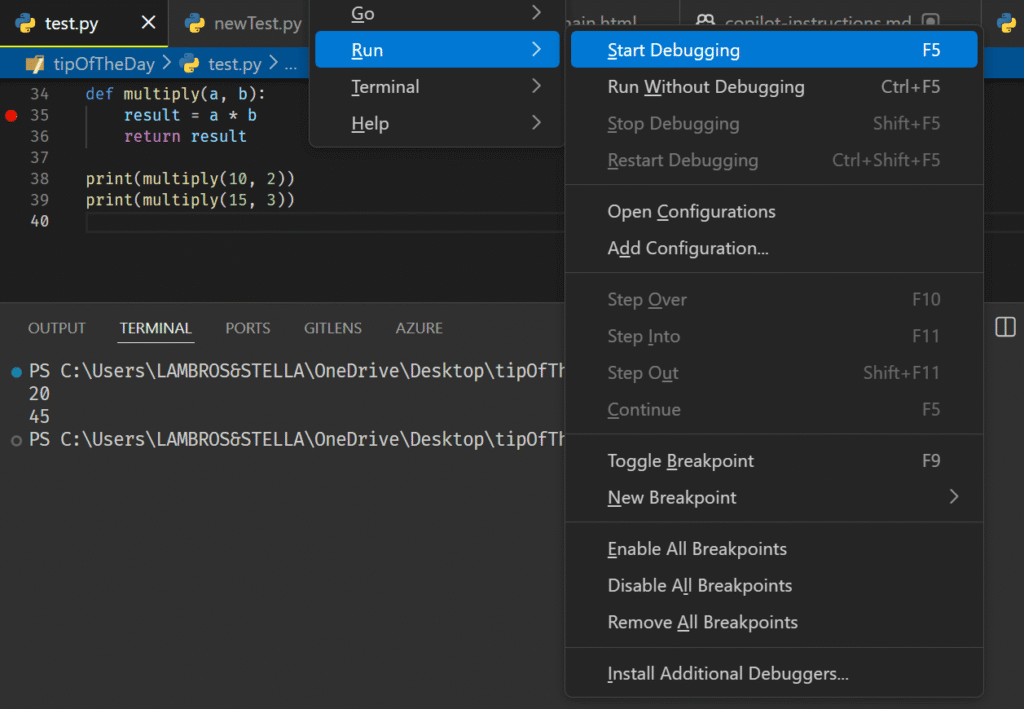
Step 3: Start the debugging
- Go to
Run > StartDebugging - The debugger will stop running at your breakpoint.
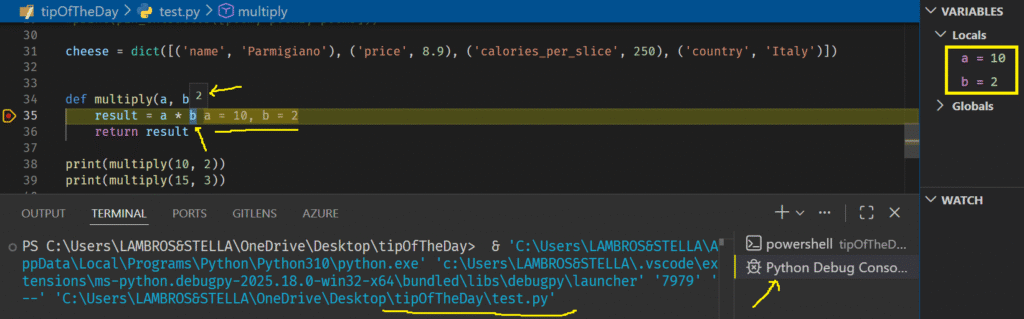
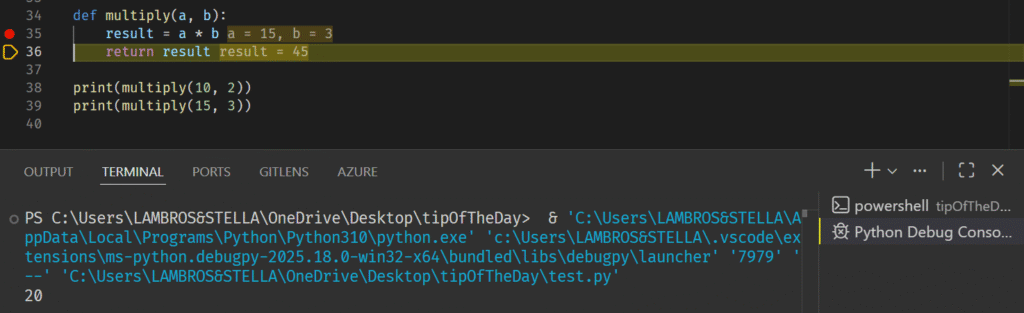
Step 4: Inspect variables
- Hover over variables to see their current values
- Use the Variables panel (on the right) to see all local variables
Step 5: Moving through code
Use the debug toolbar to execute the current line and move to the next by pressing F10.
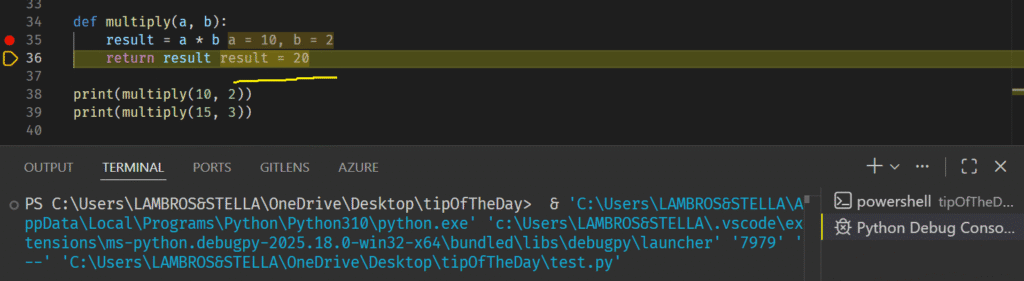
And we keep moving:
And we inspect the new result:
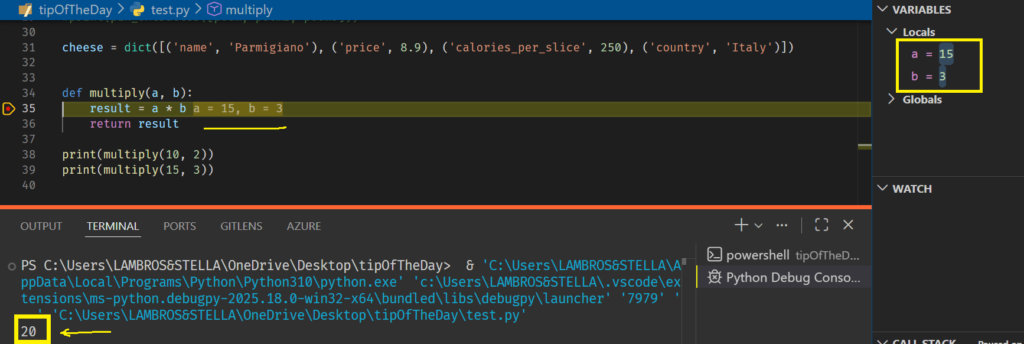
IDE debugging tools offer a user-friendly graphical interface that allows you to examine your program’s state. This makes it much easier to spot and fix problems compared to relying solely on print statements.
Use the Python standard library
Python has pdb, a debugger in your standard library.
The pdb debugger is an interactive tool that lets you pause your program, inspect what is happening, and step through code line by line. Since it is part of the standard library, you can use it without installing anything.
What pdb is designed to do
Pdb gives you a controlled environment where you can stop your program at a specific point, check the values of variables, move forward one line at a time, and continue execution until the next breakpoint.
This makes it useful when print statements are not enough, and you need a closer look at how your code behaves.
Using pdb for debugging
First, you import the module.
Then you use the .set_trace method to navigate your code, inspect the variables, and understand how the program works.
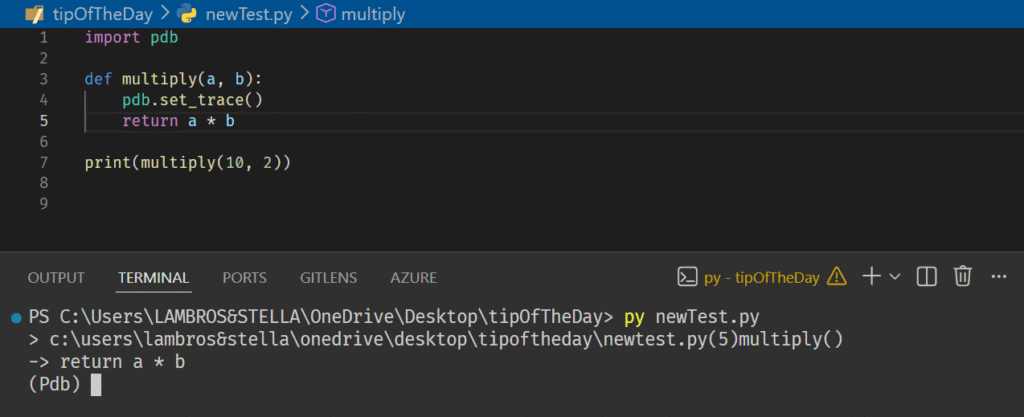
This stops execution at that line 5 and opens the debugger prompt.
Then you apply the right commands for debugging your code.
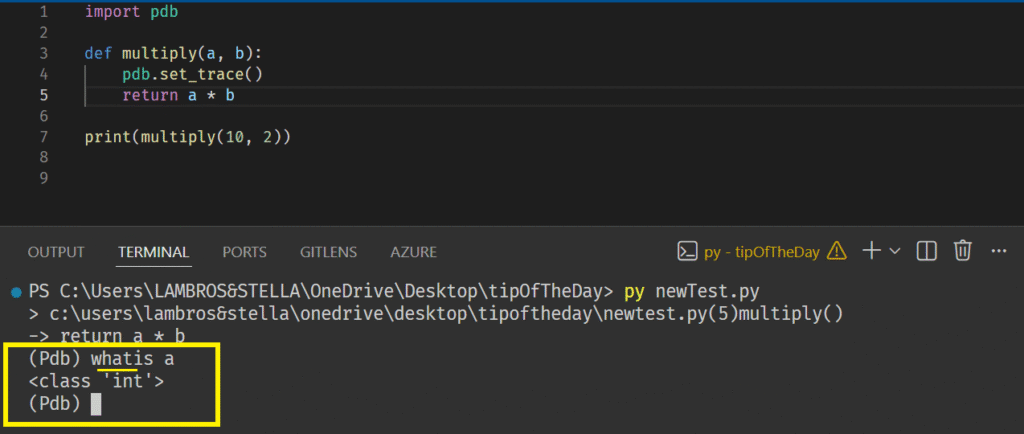
As an example, if you want to check the types of elements in your code at that time, you can use the whatis command:
To keep your code running, you can use the continue command, or its shortcuts, cont or c.
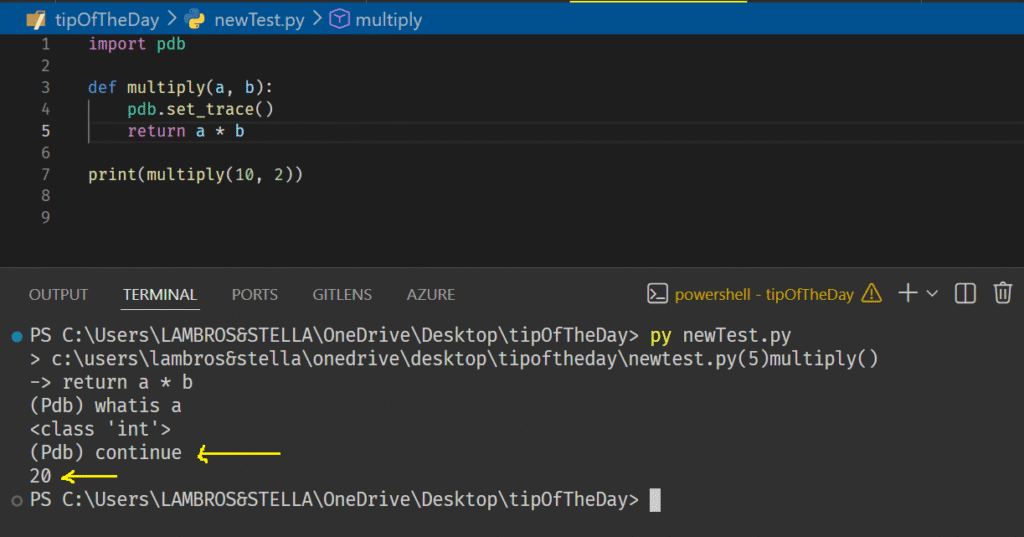
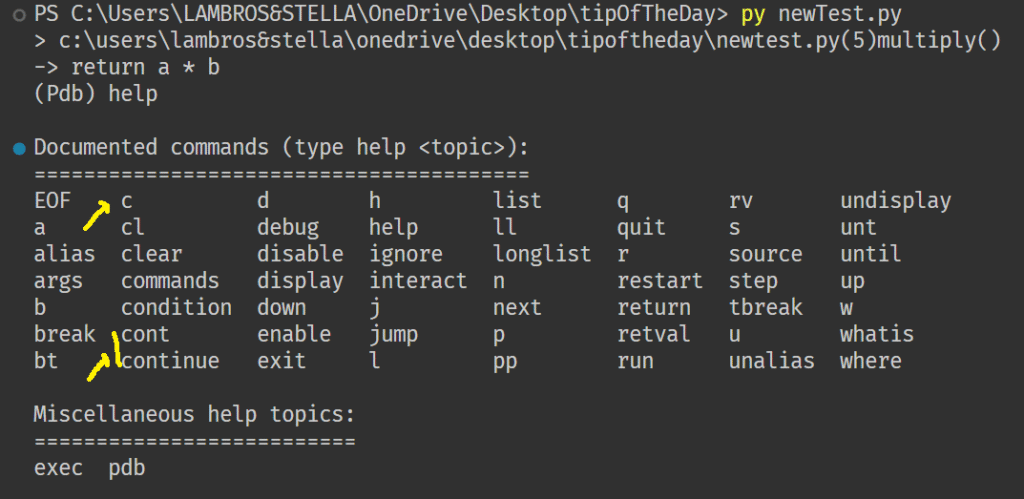
Note: To step out of the debugger prompt, just enter quit or its alias q
Conclusion
By learning these essential debugging techniques—like using print() statements, the pdb module, and tools in your IDE—you’ll be able to effectively identify and fix problems in your Python code.
Every technique has its own role: print() statements are great for quick checks, pdb is useful for interactive exploration, and IDE debuggers allow for visual inspection.